
A researcher at Stanford University says there was very little falsification in Putin’s latest re-election, and here’s how he crunched those numbers
Vladimir Putin is president, again. On May 7, he took the oath of office at his fourth inauguration, following a blowout re-election victory on March 18, when observers and journalists catalogued numerous violations and voting irregularities. Putin called it the “cleanest election” in Russian history. According to Kirill Kalinin — an expert in election fraud and a fellow at Stanford University’s Hoover Institution with a Ph.D. in political science from the University of Michigan — there is evidence of some voter fraud in Putin’s favor. At Meduza’s request, Kalinin wrote about the preliminary results of his study, the methodology he used, and its limitations.
Was there much fraud in Russia’s 2018 presidential election?
According to our calculations, there could be as many as 320,000 fraudulent votes, which is less than one percent of the number of votes cast for Putin. This falsification might have affected as much as four percent of Russia’s polling stations. The level of fraud was small compared to the two million fraudulent votes we calculated in the 2016 parliamentary elections. The falsification in March 2018 is more on par with the irregularities we observed in Russia’s 2004 elections.
We tracked the most voter falsification in the following regions:
- Krasnodar
- Kemerovo
- Bashkortostan
- The Yamalo-Nenets Autonomous Oblast
- Stavropol
- Tatarstan
- North Ossetia
- Dagestan
Our analysis shows that the results were usually falsified by ballot stuffing — a typical tactic in Russian elections.
How did you measure this falsification?
We used a statistical model — the so-called “finite mixture model” — developed in 2016 by Walter Mebane, which he based on a model created by Peter Klimek and his colleagues in 2012.
Many people are aware that analysts working on election fraud often look at voting rates and turnout plotted on a graph. In honest elections, the normal distribution forms a bell curve with a single “peak.”
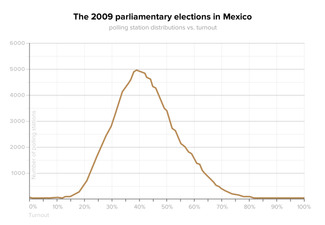
When a graph shows more than one “peak,” it raises questions about the results of an election.

Mebane’s model helps researchers understand the origins of these additional “peaks,” telling us whether they are caused by fraud or some anomaly that doesn’t break the law.
What kind of anomalies?
All kinds. These “peaks” can be the result of peculiar electoral behavior in particular regions, the formation of election coalitions, the existence of small settlements or military barracks, and so on. In Canada or Germany, for instance, the distributions of party voting take a number of bizarre shapes that you could easily mistake for voter fraud, if you didn’t consider the country’s social and cultural heterogeneity.
How does the Mebane model work?
As initial data, the model uses three variables to calculate turnout and the percentage obtained by the winner:
- The total number of registered voters
- The total number of voters who cast ballots
- The number of voters who voted for the winning candidate
The model identifies anomalies in turnout and vote distribution, but it doesn’t equate all anomalies with fraud. At each polling station where irregular voting occurs, the model accommodates three possibilities:
- Clean voting
- Incremental fraud, where a substantial number of votes are reallocated to the winner
- Extreme fraud, where almost all the votes are shifted to the winner
At polling stations where incremental fraud takes place, turnout is slightly and artificially elevated, but the percentage of votes received by the winner increases. With extreme fraud, you see a proportional spike in turnout and the percentage of votes going to the winner.
The Mebane model makes it possible to estimate the likelihood that voting at each polling station in a specific region was either honest or marred with ballot stuffing or rigging, and it also offers a way to calculate the total number of stolen votes. The main value of the model is that we can use it to study anomalies at any level, from individual polling stations to nationwide voting.
Does the Mebane model have limitations?
Yes, there are some limitations. The model assumes that only the winning candidate is able to influence election outcomes by means of fraud, through rigging and ballot stuffing. The model does a good job capturing falsification mechanisms in majority-voting systems where there’s a clear winner (in presidential races and single-seat constituencies), but there can be complications when applying it to proportional election systems because of difficulties determining a clear winner. Moreover, the model cannot identify falsification that doesn’t produce extra “peaks” when graphing the distribution of votes and turnout.
With the Mebane model, it’s only possible to estimate the scale of the anomalies that can be interpreted as election fraud with a high degree of probability. The model does not claim to make universally applicable estimates, and it absolutely doesn’t prove the existence of any real fraud. The model is more of an indicator, and incontrovertible evidence is needed to confirm that falsification was actually carried out.
The accuracy of this research approach depends on the model’s ability to reproduce and assess real mechanisms for voter falsification. The Mebane model has proved useful in many elections: For example, it identified violations in the Turkish parliamentary elections in June and November 2015 (the ruling party first lost and then regained a majority in the parliament); it failed to find any irregularities in the Austrian presidential election in spring 2016 (the election was eventually invalidated because of formal procedural infractions, but not because of fraud); and it uncovered fraud in the Kenyan presidential election in August 2017 (where the Kenyan Supreme Court annulled the election because of numerous violations).
There are other ways of measuring the presence of falsification, such as evaluating “coarse vote-shares” (peaks at round turnout values, like 0.50, 0.60, 0.75 and so on). According to our computations, 0.66 percent of polling stations in Russia’s last election showed anomalies involving peaks at round turnout values, which is comparable with elections in 2004. (For comparison, this figure was 0.06 percent in 2000 and 0.85 percent in 2016.) Some of these methods have become part of the Election Forensics Toolkit. Of course, if several different methods indicate that there was fraud, we can say with greater confidence that the elections were not clean.
Sergey Shpilkin has published alternative calculations showing a much higher level of falsification. How do you explain the difference in your findings?
That’s a complex question in need of further study. The difference between our estimates of fraud is indeed colossal, and it probably stems from differences in our approaches.
Sergey Shpilkin calculates that the winner in Russia’s March 2018 presidential election received 6.5 million votes thanks to ballot stuffing and another 1 million votes snatched from other candidates.
Unlike our approach, which is based on a model that reproduces a mechanism for transferring votes to the winning candidate, Sergey Shpilkin proposes his own algorithm for calculating fraud based on an empirical distribution of turnout and voting that is not based on any model. Shpilkin assumes that people participate in elections and vote roughly the same way, so the votes anywhere should conform to a single-peaked distribution resembling a single bell curve. Using this approach, the “clean peak” can always be identified even in the event of serious fraud, and the information derived from that peak will help calculate the overall scale of fraud.
Our findings also diverged substantially in the 2016 elections. Additional analysis showed that our approaches are more or less consistent when ranking regions in terms of fraud, but they measure the scale of this falsification differently.
I hesitate to say whose calculations — ours or Sergey Shpilkin’s — are closer to the truth. I will say that our method has an important advantage when it comes to the level of analysis: We can get estimates at individual polling stations, and this in theory allows us to compare our data with reports by election observers. In the event of significant discrepancies between calculated and observed falsification, we can always revise certain parts of the model. In any case, we’re only at the very beginning of a long road to develop a complete statistical model that will shed light on the scale and nature of election fraud.
Sergey Shpilkin refused to comment on Kirill Kalinin's work, describing the Mebane model as “insanely complicated and totally nonviable.”
Text by Kirill Kalinin, translation by Peter Marshall and Kevin Rothrock
