Deadliest outside the big cities Though the majority of Russia’s coronavirus cases have been recorded in Moscow, demographic and epidemiological data suggest more remote areas are most vulnerable. We mapped it.
Based on data available on March 28, most of Russia’s confirmed COVID-19 cases were in Moscow, the Moscow region, and St. Petersburg. This is unsurprising: national capitals everywhere have taken the first blow in this pandemic because they’re the most connected to international travel. The media’s focus on megapolises can be misleading, however, insofar as it creates the impression that coronavirus has somehow spared more remote areas. That is not the case. Given the age demographics of many regions in Russia, it is outside Moscow and St. Petersburg where we can expect to see the most difficult situations, both in terms of the number of patients needing assistance and the number of deaths. At Meduza’s request, demographer Ilya Kashnitsky and epidemiologist Anton Barchuk compared Russia’s regions by the number of people who could need hospitalization and the amount of locally available medical resources. The two experts created an interactive map that helps doctors in Russia assess the seriousness of the COVID-19 crisis in different parts of the country and makes it clear how important it is to delay the epidemic’s peak by as long as possible (to “flatten the curve”).
Attention! For the best reading experience, this article should be viewed from a full Internet browser. The maps embedded below will not display correctly on mobile devices. Also, please note that all Meduza content about the coronavirus pandemic is free to distribute according to Creative Commons CC BY 4.0. You can republish this stuff! (But that doesn’t apply to any photographs featured in our stories.)
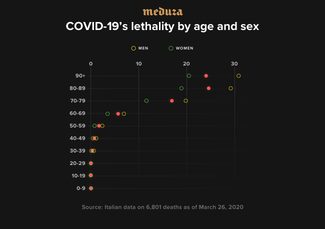
With COVID-19, the disease caused by the new coronavirus, the risks of complications, hospitalization, need for intensive care, and death are distributed extremely unevenly by age. Children and younger people are nearly out of danger, but the risks are significant for older generations. Additionally, at any age, the disease is more dangerous for men than women. The figure below demonstrates COVID-19’s lethality in Italy as of late March.
Populations’ age structures vary widely between different countries and between different regions within the same country. Given COVID-19’s uneven lethality indexes for age and sex, the logical conclusion, other things being equal, is that severe cases will be greater in relatively more elderly populations. In part, we see the effect of a population’s age structure in the pandemic’s first comparative data by country: the number and proportion of severe cases of the illness are much higher in Italy than in places like South Korea, where the population is relatively younger. We can observe even more significant differences in populations’ age structure between central and peripheral regions within specific European countries. The epidemic naturally begins in the most densely populated major cities. Once the disease is widespread, however, peripheral regions (where populations are generally older) are the most vulnerable.
On the interactive map below, you can see the total number of people in different regions across Russia who could need intensive care at some point during the coronavirus epidemic. The darker the shading, the greater the proportion of severe COVID-19 cases in a region’s population. Below the map, you can find the same information laid out in a table.
Region
40%
50%
60%
70%
80%
Altai Krai
13672
17088
20507
23925
27343
Amur Oblast
3807
4759
5711
6666
7615
Arkhangelsk Oblast
6346
7932
9520
11105
12691
Astrakhan Oblast
5524
6906
8286
9667
11048
Belgorod Oblast
9536
11916
14300
16683
19066
Bryansk Oblast
7433
9294
11152
13011
14866
Vladimir Oblast
8751
10939
13124
15314
17502
Volgograd Oblast
15723
19653
23583
27516
31446
Vologda Oblast
6602
8256
9905
11555
13207
Voronezh Oblast
15284
19107
22926
26749
30571
Jewish Autonomous Oblast
762
954
1144
1334
1526
Zabaykalsky Krai
4559
5701
6841
7979
9118
Ivanovo Oblast
6380
7975
9570
11165
12761
Ingushetia
1525
1903
2286
2668
3050
Irkutsk Oblast
11628
14536
17444
20350
23258
Kabardino-Balkarian Republic
4037
5045
6055
7067
8072
Kaliningrad Oblast
5573
6968
8361
9753
11148
Kaluga Oblast
6293
7863
9441
11013
12586
Kamchatka Krai
1366
1708
2052
2392
2733
Karachay-Cherkessia
2386
2982
3578
4177
4773
Kemerovo Oblast
14641
18301
21960
25624
29282
Kirov Oblast
8013
10017
12020
14023
16028
Kostroma Oblast
3877
4845
5814
6782
7753
Krasnodar Krai
33657
42074
50485
58900
67316
Krasnoyarsk Krai
14195
17746
21294
24843
28392
Kurgan Oblast
5313
6641
7971
9298
10627
Kursk Oblast
7003
8756
10508
12257
14009
Leningrad Oblast
11454
14315
17178
20041
22903
Lipetsk Oblast
7225
9038
10843
12651
14456
Magadan Oblast
603
751
900
1054
1202
Moscow
83861
104830
125792
146758
167724
Moscow Oblast
42153
52693
63228
73769
84309
Murmansk Oblast
3400
4250
5100
5951
6799
Nenets Autonomous Okrug
172
214
258
301
342
Nizhny Novgorod Oblast
19795
24741
29694
34641
39589
Novgorod Oblast
3875
4845
5810
6781
7749
Novosibirsk Oblast
15384
19228
23077
26920
30766
Omsk Oblast
10531
13162
15795
18427
21063
Orenburg Oblast
10877
13596
16314
19032
21755
Oryol Oblast
4737
5922
7108
8292
9476
Penza Oblast
8703
10883
13058
15235
17410
Perm Krai
13928
17409
20893
24374
27854
Primorsky Krai
10215
12767
15323
17875
20427
Pskov Oblast
4085
5105
6127
7149
8171
Adygea Republic
2651
3317
3979
4642
5304
Altai Republic
842
1051
1264
1474
1684
Republic of Bashkortostan
21819
27269
32724
38178
43633
Buryatia
4247
5311
6369
7431
8494
Republic of Dagestan
10477
13094
15713
18331
20952
Kalmykia Republic
1297
1623
1946
2271
2598
Republic of Karelia
3583
4479
5376
6271
7168
Komi Republic
3889
4862
5833
6806
7779
Republic of Crimea
11947
14936
17920
20908
23896
Mari El Republic
3688
4610
5531
6455
7377
Mordovia Republic
4899
6126
7350
8578
9803
Sakha Republic
3455
4322
5183
6046
6913
North Ossetia–Alania Republic
3866
4828
5797
6762
7729
Republic of Tatarstan
21702
27125
32550
37974
43398
Tuva Republic
784
982
1179
1377
1572
Republic of Khakassia
2621
3277
3932
4587
5244
Rostov Oblast
25888
32359
38830
45305
51773
Ryazan Oblast
7645
9557
11470
13382
15292
Samara Oblast
19128
23906
28692
33475
38255
St. Petersburg
33965
42457
50948
59440
67927
Saratov Oblast
15278
19098
22918
26740
30556
Sakhalin Oblast
2327
2904
3484
4067
4648
Sverdlovsk Oblast
24177
30221
36267
42308
48352
Sevastopol
2706
3382
4059
4735
5416
Smolensk Oblast
5794
7245
8695
10144
11591
Stavropol Krai
15689
19608
23531
27452
31375
Tambov Oblast
7066
8830
10597
12364
14129
Tver Oblast
8241
10304
12364
14425
16484
Tomsk Oblast
5421
6780
8134
9488
10846
Tula Oblast
10091
12614
15134
17659
20179
Tyumen Oblast
7131
8915
10696
12478
14262
Udmurt Republic
7901
9876
11850
13826
15802
Ulyanovsk Oblast
7836
9796
11754
13714
15672
Khabarovsk Krai
6537
8170
9805
11439
13072
Khanty-Mansi Autonomous Okrug
5343
6679
8014
9349
10690
Chelyabinsk Oblast
19694
24623
29544
34472
39394
Chechnya
3372
4214
5059
5905
6746
Chuvashia Republic
6912
8637
10367
12094
13821
Chukotka Autonomous Okrug
146
183
218
253
290
Yamalo-Nenets Autonomous Okrug
1311
1641
1965
2293
2624
Yaroslavl Oblast
7954
9942
11930
13916
15905
In the event of an uncontrolled or poorly controlled outbreak, the number of seriously ill patients very quickly exceeds the number of available hospital beds. This is especially true for space in intensive care units equipped with ventilators. In this scenario, more remote regions are again the most vulnerable.
The map below demonstrates a situation where 40 percent of Russia’s population contracts COVID-19 and the epidemic’s peak arrives after five, 10, or 20 weeks. In reality, this timeframe will depend on the effectiveness of Russia’s containment measures. The map displays the predicted number of people in intensive care in each region of the country per available ventilator.
Region
10 weeks
20 weeks
40 weeks
Altai Krai
2
0.89
0.44
Amur Oblast
1.39
0.63
0.35
Arkhangelsk Oblast
1.18
0.54
0.3
Astrakhan Oblast
2.72
1.17
0.62
Belgorod Oblast
3.68
1.68
0.86
Bryansk Oblast
4.66
2.18
1.14
Vladimir Oblast
2.47
1.07
0.57
Volgograd Oblast
3.52
1.62
0.83
Vologda Oblast
2.69
1.21
0.6
Voronezh Oblast
5.03
2.23
1.14
Jewish Autonomous Oblast
0.96
0.48
0.27
Zabaykalsky Krai
1.68
0.82
0.42
Ivanovo Oblast
3.1
1.37
0.74
Ingushetia
4.52
1.94
1.15
Irkutsk Oblast
2.12
0.97
0.46
Kabardino-Balkarian Republic
2.64
1.13
0.66
Kaliningrad Oblast
2.07
0.94
0.48
Kaluga Oblast
7.08
2.92
1.61
Kamchatka Krai
1.74
0.81
0.45
Karachay-Cherkessia
2.38
1.11
0.58
Kemerovo Oblast
2.41
1
0.52
Kirov Oblast
1.84
0.84
0.45
Kostroma Oblast
2.53
0.99
0.57
Krasnodar Krai
3.96
1.74
0.88
Krasnoyarsk Krai
2.03
0.92
0.48
Kurgan Oblast
7.41
3.52
1.95
Kursk Oblast
2.11
0.92
0.54
Leningrad Oblast
3.93
1.78
0.86
Lipetsk Oblast
2.06
0.88
0.49
Magadan Oblast
1.32
0.67
0.37
Moscow
1.53
0.65
0.33
Moscow Oblast
2.17
0.92
0.47
Murmansk Oblast
1.32
0.54
0.31
Nenets Autonomous Okrug
1.04
0.5
0.38
Nizhny Novgorod Oblast
3.37
1.47
0.8
Novgorod Oblast
3.67
1.7
0.92
Novosibirsk Oblast
1.81
0.8
0.43
Omsk Oblast
3.43
1.46
0.79
Orenburg Oblast
2.39
1.07
0.54
Oryol Oblast
1.6
0.73
0.38
Penza Oblast
2.48
1.12
0.58
Perm Krai
2.25
0.92
0.52
Primorsky Krai
3.2
1.41
0.71
Pskov Oblast
2.72
1.12
0.62
Adygea Republic
2.96
1.38
0.81
Altai Republic
0.65
0.35
0.17
Republic of Bashkortostan
3.34
1.42
0.75
Buryatia
2.11
0.95
0.51
Republic of Dagestan
6.24
2.86
1.52
Kalmykia Republic
2.67
1.38
0.72
Republic of Karelia
2.13
0.91
0.52
Komi Republic
1.68
0.74
0.39
Republic of Crimea
1.99
0.88
0.47
Mari El Republic
1.5
0.67
0.37
Mordovia Republic
4.44
2.13
1.12
Sakha Republic
1.16
0.52
0.27
North Ossetia–Alania Republic
2.49
1.14
0.58
Republic of Tatarstan
1.59
0.66
0.35
Tuva Republic
0.58
0.26
0.17
Republic of Khakassia
1.62
0.74
0.48
Rostov Oblast
4.03
1.78
0.93
Ryazan Oblast
3.02
1.29
0.75
Samara Oblast
2.42
0.98
0.55
St. Petersburg
1.68
0.73
0.37
Saratov Oblast
3.29
1.42
0.77
Sakhalin Oblast
0.94
0.44
0.24
Sverdlovsk Oblast
2.58
1.09
0.57
Sevastopol
2.13
1.03
0.54
Smolensk Oblast
6.22
2.84
1.46
Stavropol Krai
0.8
0.36
0.19
Tambov Oblast
1.08
0.49
0.25
Tver Oblast
4.54
2.03
1.05
Tomsk Oblast
1.52
0.71
0.38
Tula Oblast
3.94
1.74
0.92
Tyumen Oblast
1.36
0.6
0.33
Udmurt Republic
3.15
1.29
0.72
Ulyanovsk Oblast
6.99
3.07
1.59
Khabarovsk Krai
2.56
1.11
0.59
Khanty-Mansi Autonomous Okrug
0.58
0.26
0.15
Chelyabinsk Oblast
2.9
1.25
0.68
Chechnya
2.58
1.16
0.6
Chuvashia Republic
1.93
0.83
0.46
Chukotka Autonomous Okrug
1.92
0.83
0.67
Yamalo-Nenets Autonomous Okrug
0.97
0.54
0.27
Yaroslavl Oblast
2.36
1.08
0.55
How we counted (methodological details for specialists)
In our calculations, we used available data on Russia’s current sex and age demographics. The proportion of people expected to need intensive care corresponds to projections adopted in a report published on March 19, 2020, by the Imperial College COVID-19 Response Team, titled “Impact of Non-Pharmaceutical Interventions (NPIs) to Reduce COVID-19 Mortality and Healthcare Demand.” These data, in turn, were obtained by modeling and analyzing statistics from China. The proportions were adjusted for the differences in COVID-19’s fatality risks for men and women observed in Italy.
It is very difficult now to estimate the proportion of people who may be infected during the current epidemic, so we modeled multiple scenarios, assuming that the disease will spread to between 40 and 80 percent of Russia’s population. The actual value here will depend on the Rₒ coefficient, which reflects the number of people in the vulnerable population who are infected on average by one carrier of the disease. Our calculations did not take into account differences in the proportion of infected people between different age groups. In reality, the proportion of infected people in Russia could be lower in older age groups because older people generally have fewer social contacts.
To estimate the number of available ventilators in Russia, we used data obtained from public procurement contracts issued between 2017 and 2020 and public contracts for the comprehensive maintenance of medical equipment in 2019 and 2020. To assess the presence of this machinery at facilities where we could not find published contract records, we looked at the distribution of medical apparatuses by device-age/depreciation, the size of surgical departments and intensive care units, and a comparative analysis of the availability of other types of intensive-care equipment. All data about ventilators were provided by the Moscow-based “Headway Company,” and we also used some open-source information.
To calculate the epidemic’s peak surge, we relied on a spreadsheet-based model provided by the Centers for Disease Control and Prevention in the United States, which estimates the surge in demand for hospital-based services during the next influenza pandemic. We modeled three scenarios for the spread of COVID-19, where the peak occurs at the fifth, 10th, and 20th week after the outbreak’s start, and assumed that the average ICU stay is five days.
In the event of a rapid and effective implementation of measures to contain the epidemic, the peak surge in demand for ICU space will be significantly lower than in the absence of such measures. According to our calculations, should the epidemic peak as soon as its fifth week, the number of patients requiring intensive care will be more than the number of ventilators in most regions across Russia. If Russia is able to “flatten” its epidemiological curve, delaying the COVID-19 peak to the epidemic’s 20th week, there will be sufficient medical resources to treat patients in almost all regions nationwide.
The peak surge per individual ventilator is largely a provisional value — it should be understood foremost as a way to compare regions, taking into account their medical resources and expected numbers of severe COVID-19 cases. The actual peak surge in different regions will depend on many parameters that are very hard to assess now, such as the number of infections, the epidemic’s length, and the timing of the peak surge — all of which are determined by the extent and effectiveness of containment measures.
In real-world conditions, the peak surge will also depend greatly on the use of available medical equipment and resources. Not all ventilators are located at facilities that are likely to get many severe cases of COVID-19. On the other hand, some ventilators can work on multiple patients simultaneously.
The number of COVID-19 patients we expect to need intensive care in Russia coincides largely with a forecast by Sofia Garushyants and Georgy Bazykin, whose methodology is similar to ours. The differences between our forecasts are due primarily to the fact that our study takes into account the proportion of men and women in Russia’s population. Because the number of more elderly men in most regions is far lower than older women, the number of COVID-19 patients requiring intensive care in these areas will also be lower.
All the source data and code used to make the calculations found above are available here on GitHub.
- Ajelli, M., & Litvinova, M. (2017). Estimating contact patterns relevant to the spread of infectious diseases in Russia. Journal of Theoretical Biology, 419, 1–7. https://doi.org/10.1016/j.jtbi.2017.01.041
- Dowd, J. B., Rotondi, V., Adriano, L., Brazel, D. M., Block, P., Ding, X., Liu, Y., & Mills, M. C. (2020). Demographic science aids in understanding the spread and fatality rates of COVID-19. MedRxiv. https://doi.org/10/ggpcj9
- Ferguson, N., Laydon, D., Nedjati Gilani, G., Imai, N., Ainslie, K., Baguelin, M., Bhatia, S., Boonyasiri, A., Cucunuba Perez, Z., Cuomo-Dannenburg, G., Dighe, A., Dorigatti, I., Fu, H., Gaythorpe, K., Green, W., Hamlet, A., Hinsley, W., Okell, L., Van Elsland, S., … Ghani, A. (2020). Report 9: Impact of non-pharmaceutical interventions (NPIs) to reduce COVID19 mortality and healthcare demand [Report]. https://doi.org/10.25561/77482
- Istituto Superiore di Sanità. (2020, March 26). Integrated surveillance of COVID-19 in Italy. https://www.epicentro.iss.it/coronavirus/sars-cov-2-sorveglianza-dati
- Kashnitsky, I., & Aburto, J. M. (2020). COVID-19 in unequally ageing European regions. OSF Preprint. https://doi.org/10.31219/osf.io/abx7s
- Neyman, G., & Irvin, C. B. (2006). A Single Ventilator for Multiple Simulated Patients to Meet Disaster Surge. Academic Emergency Medicine, 13(11), 1246–1249. https://doi.org/10.1197/j.aem.2006.05.009
- Verhagen, M. D., Brazel, D. M., Dowd, J. B., Kashnitsky, I., & Mills, M. (2020). Mapping hospital demand: Demographics, spatial variation, and the risk of «hospital deserts» during COVID-19 in England and Wales. OSF Preprint. https://doi.org/10.31219/osf.io/g8s96
- Verity, R., Okell, L. C., Dorigatti, I., Winskill, P., Whittaker, C., Imai, N., Cuomo-Dannenburg, G., Thompson, H., Walker, P., Fu, H., Dighe, A., Griffin, J., Cori, A., Baguelin, M., Bhatia, S., Boonyasiri, A., Cucunuba, Z. M., Fitzjohn, R., Gaythorpe, K. A. M., … Ferguson, N. (2020). Estimates of the severity of COVID-19 disease. MedRxiv. https://doi.org/10.1101/09.03.2020.20033357v1
Written by Ilya Kashnitsky, a postdoc at Interdisciplinary Center on Population Dynamics, University of Southern Denmark and a junior research fellow in the Institute for Social Development Studies at the National Research University Higher School of Economics, and Anton Barchuk, a researcher at the University of Tampere in Finland and the Petrov National Cancer Center in St. Petersburg
Edited by Alexander Ershov and translated by Kevin Rothrock
Cover photo: Dmitry Feoktistov / TASS / Scanpix / LETA