
Harsh but necessary Mathematical modeling shows that Moscow’s citywide lockdown is needed to prevent coronavirus from killing more than 100 thousand people
Moscow Mayor Sergey Sobyanin has placed stringent limits on the freedom of movement in Russia’s capital to stem the tide of the COVID-19 pandemic. To model what would have happened if he had not taken those measures and what could happen now that he has, we turned to Moscow State University Associate Professor Mikhail Tamm. He used the same statistical models that prompted the government of Illinois to introduce a strict stay-at-home order in Chicago. The results: It’s clear that interpersonal contact in Moscow must be limited severely and as soon as possible. That’s the only way to quench the epidemic enough to prevent the city’s medical system from becoming overwhelmed, leading to thousands of deaths. Tamm’s explanation of his research predicting the pandemic’s development in Russia’s capital is translated below in full, with three graphs and one table interspersed to display his data at a glance.
What this model is and what it tells us
The SEIR model is among the tools researchers and governments use most widely to predict how epidemics will develop and then to act accordingly. In 2020, the Richard Neher group at the University of Basel fine-tuned the model to account for specific characteristics of the new coronavirus pandemic. That new version of the SEIR model was used to make calculations that ultimately spurred the government of Illinois to implement strict limitations on public life statewide and in the state’s largest city, Chicago.
The SEIR model turns on the concept of an epidemic transition: the model behaves in radically different ways depending on a variable called R₀ (pronounced are-naught). Every individual infected with a given communicable disease infects some number of other people before they are well enough not to be contagious; that number might be zero, or it might be several. R₀ is the average number of people each infected person infects. If R₀ is less than one, the epidemic declines, but if it’s more than one, the disease spreads exponentially. How exactly R₀ works depends on the specific virus in question, the percentage of the population that becomes immune to it (whether through a vaccine or by catching the bug), and the measures that population takes to stifle the epidemic (e.g. social distancing and quarantines).
The model predicts how fast an epidemic will spread, how many people will be infected in the process, how many of them will die, and how many will be in critical condition. Because critically ill patients require specialized care such as time in an intensive care unit (ICU) or artificial lung ventilation, comparing the model’s critical case numbers with healthcare system capacities can show whether or not hospitals will be overwhelmed by an influx of severely ill patients.
Like every version of the SEIR model, the coronavirus-specific one developed by the Neher group predicts how individuals move among four groups: susceptible (S), exposed (E), infectious (I), and resistant ®. This accounts for the fact that there is an incubation period after people are exposed to the virus but before they can pass it on. It also accounts for the fact that people who get sick once are unlikely to contract the virus again. On top of those rules, the COVID-19 model also adds all of the current pandemic’s main characteristics:
- The proportion of patients who reach critical condition and the proportion of patients who die both depend on the patents’ ages. Because elderly people are more likely to have severe cases of COVID-19, the model takes the age distribution of the population into account.
- COVID-19 has a specific incubation period and a specific phase when patients are contagious.
- Because many cases are asymptomatic and testing for the disease is insufficient, the model assumes that official case counts underestimate the epidemic.
- The virus may be more or less infectious depending on the time of year.
- Populations may take measures to curb the epidemic, and those measures may affect R₀.
- A population’s ability to combat COVID-19 depends on the strength of its healthcare system, especially its number of ventilators and ICU beds.
This COVID-19-specific model was the basis for the document that led the Illinois government to order all of its residents to shelter in place, including those living in Chicago, one of the largest cities in the United States.
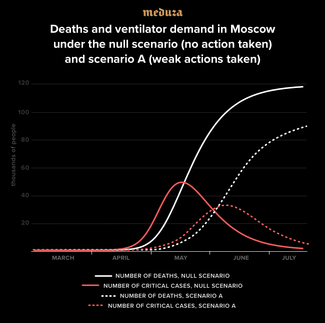
If Moscow and the Russian federal government had not taken any steps to stop the new coronavirus from spreading, then about 117,000 people in Russia’s capital might have died by this coming September. In such a case, the outbreak would have reached its peak in mid-May before declining on its own (because Muscovites who survived the disease would acquire immunity). At the peak of the pandemic, about 48,000 patients at a time would have needed ICU beds. As of March 2020, the city had only 2,500.
Weak restrictions like those the Moscow government had in place before March 28 would have decreased the number of fatalities in the pandemic to 92,000 people. The peak of that wave would have been pushed back to early June, and 32,000 people would have required critical care. This means that under a weak restrictions scenario, Moscow’s health system would still be more than overwhelmed, and that’s assuming no second wave of the pandemic would arise after any restrictive measures were lifted.
The only way to achieve a radical improvement over those numbers is to take severe steps, such as banning Muscovites from going outdoors for any non-essential purpose and punishing those who violate shelter-in-place rules. However, the effectiveness of those measures fundamentally depends on when they’re introduced. Because Moscow is entering a significant shutdown this week, models point to a total death count of 250 in the city, an epidemic peak in mid-April, and no more than 80 critical cases at any given time. If these stringent policies had been introduced later, then both the eventual number of fatalities and the number of people needing critical care would have been an order of magnitude larger.
The COVID-19 pandemic in Moscow: prognoses and scenarios
I. How epidemic models work: the SIR model, the SEIR model, and new modifications
As the COVID-19 pandemic continues its rapid spread, mathematical models that predict its progression have understandably attracted a lot of attention. In this rapidly changing situation, both governments and the general public need a way to orient themselves and a solid basis for the decisions they make. Fortunately, the science of modeling epidemics is well-developed, and researchers have a good understanding of how exactly they can describe the spread of a disease ahead of time.
The basic model for disease spread — the “gold standard,” if you will — is the so-called SIR model. That stands for Susceptible, Infected, Recovered. SIR was first proposed in the 1920s by two Scottish epidemiologists, Kermack and McKendrick, and it’s been well-studied ever since. Detailed explanation of the model are available in a number of textbooks, and Wikipedia’s description isn’t bad either.
In the SIR model, the whole population is divided into three groups, also called compartments, depending on how the illness at hand is affecting them: The susceptible group is not infected but could become so; the infected group is, well, infected; and the recovered group has had the disease but no longer does. Over time, S → I and I → R transitions can occur.
The simplest version of the model assumes the following:
- Within any given time span, the number of people who recover from a disease is proportional to the number of people who are infected. In other words, anyone who is sick has a fixed probability of getting better within a given period of time.
- The number of new infections at any given time is proportional to the product of the number of infected people and the number of susceptible people. This assumption is based on the idea that diseases are transferred through “dangerous” contacts, meaning moments when people who have the disease and people who might still get it are close to one another. If the total number of times people are in contact with each other is constant over a given period in a given population and if the population is thoroughly mixed, then the rate of “dangerous” contacts is proportional to the product of the infected population and the susceptible population.
The SIR model has two key parameters: t, which is the typical recovery time for an infected person, and R₀, which is the relationship between the time it takes someone to infect someone else and the time it takes someone to recover. In more concrete terms, R₀ can be understood as the number of people who get the infection from the average infected person before that person’s body beats the virus.
The essential concept behind the SIR model is the epidemic transition: how an epidemic behaves changes radically depending on whether R₀ is below or above one.
If R₀ < 1, infected people tend to pass the disease on to only one person or no one at all, so the number of those infected decreases over time. If R₀ > 1, however, the epidemic escalates rapidly as each infection causes an expanding chain of additional infections, and a significant portion of the population ends up getting the disease. How significant that portion is depends on exactly how high R₀ gets, but in general, we’re talking about double-digit percentages. For example, if R₀ = 2, then about 80 percent of the population ends up infected.
If part of the population has been vaccinated against the disease in question, then it gets harder for the outbreak to reach an epidemic transition. This is because if enough of the population is immune to the disease, then the spread of the disease slows to a trickle and eventually stops. This phenomenon is called “herd immunity,” and it’s what drives mass vaccination campaigns for any disease.
The SIR model provides a basic, qualitative understanding of how infectious diseases spread, but to model epidemic dynamics quantitatively, scientists need a more precise model that takes the specific disease they’re investigating into account. For example, one important aspect of many diseases is that they have an incubation period when an infected person is carrying the virus but does not show symptoms and can’t pass on the disease to anyone else. To integrate that characteristic of a disease into the SIR model, researchers separate the I (infected) group into two subgroups: E (exposed individuals located in the incubation period) and I (infectious people who can infect others). Instead of S → I → R, then, the path people take from state to state becomes S → E → I → R, and the resulting model is called SEIR in scientific literature.
Now let’s say that on top of the infection dynamics themselves, we want to estimate how much pressure a given disease will put on the healthcare system and how many people it will kill in the process. Both questions are all too natural in the case of COVID-19. Answering them requires introducing more possible categories that patients might occupy while they’re in the infectious stage. These include “severely ill” (for patients who require hospitalization), “critically ill” (for those who need a ventilator to help them breathe), and “deceased.”
The results below are based on an expanded version of the SEIR model that includes a number of these additional states as recommended by Richard Neher from the University of Basel. Neher’s version of the model was developed specifically to describe the spread of the novel coronavirus, and it is implemented through a COVID-19-specific computer program. More information about the model and its parameters can be found in the “About” section of the Neher group’s COVID-19 website.
II. Setting the model’s parameters for Moscow
To model an epidemic correctly, you need both a good base model and a good selection of quantitative parameters. Some of those parameters reflect the biology of the virus itself, so they work universally wherever the virus arises, allowing us to use data from other regions to model COVID-19 in Moscow. Other parameters are specific to particular cities or regions, and setting them up requires local data. The central parameters for this model of the Moscow epidemic are listed below from most universal to most location-specific.
1. Incubation period and infectious period averages
The average incubation time for COVID-19 is known to be around five days (Lauer S.A. et al., Annals of Internal Medicine, March 10, 2020). The period of time when an infected person doesn’t yet have symptoms but can already infect others is less well-understood, but it seems to be about three days (Y.F.W. Chan et al., Lancet, 395, 514, 2020; J.T. Wu et al., Lancet, 395, 689, 2020). Because these parameters are specific only to the virus itself, they can be used universally wherever the epidemic spreads.
2. Registration accuracy, outbreak severity, and mortality rates
One of the most noticeable characteristics that distinguishes COVID-19 from other diseases is the fact that the severity of the illness depends heavily on the patient’s age. In a very large portion of young people (but by no means all), the disease is asymptomatic or mild. Without a doubt, that means the number of cases recorded is significantly lower than the actual number of cases in any population. The accuracy of case counts also differs drastically from country to country because it depends on the availability of testing and the rules each country uses to determine whether somebody can receive a test. The only way to figure out exactly how many people have contracted COVID-19 is to run antibody analyses on a large portion of the population. At this point in the pandemic, that kind of testing hasn’t been run anywhere at all, so any estimated case count is an educated guess at best.
Still, any quantitative model has to make some kind of assumption about what a given observed case count tells us about the actual number of cases that exist. Neher’s model defines that relationship using a set of coefficients that depend on the population’s age distribution. You can see what they all mean in the “Severity assumptions and age-specific isolation” section of the Neher group’s website. Only the most important details will be reviewed here.
The model assumes that the percentage of people whose illnesses are not tested or recorded varies from 50 percent (for people over 80 years old) to 95 percent (for children and teens). Assuming such a large fraction of unobserved cases seems pretty rational — otherwise, it would be impossible to explain the radical differences in the lethality of COVID-19 between countries with sparse testing, like Italy and Spain, and areas with more thorough testing such as South Korea and Scandinavia.
To estimate the deadliness of the virus for severe cases while taking patients’ ages into account, my model uses data collected from about 70,000 Chinese patients from December through February. From there, the model estimates mortality coefficients for specific countries or regions by combining the Chinese data with the age distribution of the local population being modeled. Neherlab.org has a number of age distributions automatically integrated into its modeling options, and that set includes the age distribution for Russia. I used that feature to make some preliminary, automatic calculations. Then, I manually introduced corrections to account for the difference between Russia’s overall age pyramid and Moscow’s local one.
3. Seasonality
Other coronaviruses that have spread through humans before are known to be somewhat seasonal: The diseases they cause are more common in winter than in summer. This allows us to assume that the new coronavirus becomes 20 percent more infectious in the winter, reaching peak contagion on January 1, and 20 percent less infectious in the summer, with a minimum on July 1. For short-term prognoses, this factor is less important because in late March and early April, the virus should be about as infectious as it is on average throughout the year. However, for predictions that reach a few months into the future, seasonality does matter.
4. How long patients spend in the severely ill stage
This includes two factors: (1) the average time a severely ill patient spends in the hospital before they are released or their condition gets worse and (2) the average time critically ill patients spend attached to a ventilator. Neher’s basic model puts those numbers at four and 14 days, respectively. Sergei Maslov and Nigel Goldenfeld of the University of Illinois at Urbana-Champaign used data from Illinois to propose two different numbers: seven days on average for the severely ill and seven days for patients on ventilators. I have used Maslov and Goldenfeld’s numbers. It’s important to note that the Illinois estimates are, in a way, more optimistic because the limiting factor for the Moscow healthcare system in dealing with the COVID-19 pandemic will likely be the number of accessible, useable ventilators. If each patient tends to need artificial help with their breathing for a shorter period of time, that increases the system’s ability to handle the crisis as a whole.
5. The basic reproduction number R₀
Unlike purely biological parameters like the incubation period for the virus, the reproduction number R₀ can be different in different countries or regions. We can naturally assume that in cities with high population densities where people come into contact more often, an epidemic spreads faster than it does in less densely populated areas. We can estimate the coefficient R₀ with a good deal of accuracy as follows: We know that in the early stages of an epidemic, the number of infected people grows exponentially. This means that the number of cases doubles every period of time we’ll call 𝜏₂. The theory of the SEIR model includes a set relationship between R₀ and that doubling time.
What’s the relationship?
Rₒ = (1 + (𝜏ₑ/𝜏₂)ln2) (1 + (𝜏ᵢ/𝜏₂)ln2), where 𝜏ₑ = 5 days is the average incubation period, 𝜏ᵢ = 3 days is the average length of time when someone is contagious, and ln2 ≈ 0.693 is the natural logarithm of the number two.
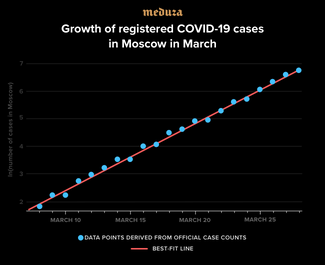
In the last 20 days, the number of confirmed coronavirus cases in Moscow has matched up wonderfully to an exponential growth curve with an average doubling time of 2.8 – 2.9 days (see the graph above). If we assume that rate doesn’t change much over time (even though we don’t have many cases yet that can shape our assumptions), we can use the formula above to find that Moscow’s R₀ ≈ 3.8 for mid-March. For comparison, during the initial outbreak of COVID-19 in Wuhan, different researchers put that number at between 2.2 and 6.5, with the average estimate hovering around 3.3 (Y. Liu et al., Journal of Travel Medicine, taa021, 27, 2020). This makes our estimate for Moscow look quite reasonable.
Taking the presumed seasonality of COVID-19 into account means that the R₀ number for mid-March should be about five percent higher than the average for the whole year. For that reason, the rest of this model will use an R₀ of 3.6.
6. Calibrating the starting time of the epidemic
Now that parameters 1 – 5 are set, all that’s left for us to get a full-fledged model is to determine at what point in the epidemic we are now. It would be hard to answer that question using official case counts alone because we don’t know what percentage of people who are actually infected have been tested and confirmed. On the other hand, the official number of coronavirus deaths in any given place is probably significantly more accurate than the overall case count. This and other factors led me to use the day Moscow’s coronavirus fatality count exceeded one as a reference point. That day was March 25. When creating the model, I set the starting date of Moscow’s infections in such a way that, within the model, Moscow’s second coronavirus death occurred on March 25.
7. Moscow’s population and age distribution
The model uses official data from Russia’s state statistics service that describes Moscow’s population and age pyramid on January 1, 2020.
8. Epidemic containment measures
There are two ways to model Moscow’s containment measures in this algorithm. One way is to add an extra “containment” parameter that shows how much any steps the city takes against the pandemic lower the basic reproduction number R₀. The other option is to take the “Severity assumptions and age-specific isolation” table and add a new multiplier that selectively lowers R₀ for a specific age group.
III. How this pandemic would look if Moscow took no steps to stop it
Now that all the parameters necessary for the model are set, let’s start by modeling the ‘natural’ course of the epidemic — that is, what would happen if no quarantines or restrictive measures were put in place.
You can see the results of that scenario along with the rest of my results in the table below. Without any containment measures, Moscow would see its infections peak around the beginning of the epidemic as a whole, and deaths would peak in mid-May. At that peak, more than 48,000 patients would simultaneously require intensive care, including ventilators for many. The total number of fatalities would be around 115,000 – 200,000 people. The majority of those killed by the virus would be elderly, with almost half over 80 years old, but about 7,000 deaths would be expected for Muscovites under 60.
It should be noted that these numbers do not take into account the fact that mortality rates would become much higher as the city’s healthcare system collapsed in this scenario. That collapse would also involve a catastrophic shortage of ventilators. To give you a sense of those shortages, Moscow now has about 2,600 ICU beds, and only a small fraction of them are already equipped with ventilators. Those numbers will grow in the coming weeks, but nonetheless, 48,000 patients would by far exceed even the most optimistic numbers for the capacity of Moscow’s healthcare system.
IV. Possible containment methods and associated epidemic scenarios
On the whole, all efforts to reduce the epidemic’s scale are aimed at reducing the R₀ coefficient. A decrease in the R₀ coefficient leads qualitatively to two different results: (a) a decrease in the total number of infected people during the epidemic and (b) a longer epidemic overall, and accordingly, a smaller number of patients at any given point in time, which reduces the burden on the healthcare system. It’s important to bear in mind that if the decrease in R₀ is small, the effect of drawing out the epidemic will be key. Reducing R₀ to lower than 1, meanwhile, will suppress the epidemic completely and, accordingly, the total number of patients will shrink in relation to the size of the total population. If the epidemic is suppressed like this, however, group immunity isn’t generated and a new rise in R₀ after quarantine restrictions are lifted creates a significant risk of a second epidemic unless the population is vaccinated.
It’s also important to understand that it’s natural to consider different containment tactics aimed primarily at reducing infections among senior citizens because the COVID-19 epidemic is especially dangerous for older people.
The main methods for reducing R₀ are (a) isolating the sick and (b) reducing the general number of social contacts in the population. In the case of COVID-19, isolating patients is a relatively ineffective way to combat the spread of the epidemic. This is because of the large number of light and asymptomatic cases that are nevertheless contagious, as well as the fact that infection typically occurs at an early stage before patients are even diagnosed.
Incidentally, this is where COVID-19 differs radically from SARS (Severe Acute Respiratory Syndrome), another contagious and sometimes fatal respiratory illness caused by a coronavirus: on average, SARS manifests far more severely than COVID-19, and patients become contagious as soon as they start to feel ill. This attribute of the disease made it possible to stop the SARS epidemic by identifying and isolating infectious patients. A similar approach to suppressing the COVID-19 epidemic seems to be showing good results in South Korea, Taiwan, and Singapore — countries with experience fighting the SARS epidemic. But this approach requires the appropriate expertise and extremely large-scale testing, and it’s apparently only effective with a sufficiently small number of detected cases (of the order of tens of people per million inhabitants).
In other words, the main containment methods available to most countries at this stage of the pandemic (including Russia) are the methods that more or less forcefully reduce the total number of social contacts in the population as a whole.
As a basic example of implementing these measures, consider Scenario A, where an entire population reduces social contacts by 20 percent on average and isolation levels are twice as high among elderly people. It seems the measures Moscow officials imposed before March 29 — closing schools and universities, prohibiting large entertainment events, advising senior citizens to stay at home, and so on — should have led to a decline of approximately this size in the level of social activity throughout the city.
These measures (see the table below) would likely have prolonged the epidemic somewhat (in this case, the peak would have come in early June), reduced the number of deaths by 20 to 25 percent, and cut the peak load on the healthcare system by about a third (reducing the number of patients needing ventilators at the epidemic’s peak from 48,000 to 32,000 people). Despite these improvements, Scenario A is still totally unacceptable, making it inevitable that the city would impose additional restrictions to combat the spread of coronavirus.
This opens the door to a handful of other scenarios where Moscow officials introduce greater limits on social contact:
Scenario B: relatively mild restrictions introduced gradually (closing stores, restaurants, and other public spaces; PSA campaigns to promote telecommuting) lead to a reduction of social contacts among the general population by half and among senior citizens by four times.
Scenario C: a strengthening of the restrictions described in Scenario A, plus a complete lockdown (similar to what many countries in Western Europe have done), but the lockdown is implemented only after Moscow’s mortality rate reaches 30 deaths per day. Residents are prohibited from leaving their homes without good reason, customers are admitted to grocery stores one at a time, all non-essential businesses are shut down, and so on. Based on data from Italy, this policy is capable of reducing social contacts by roughly five times.
Scenario D: a preventative lockdown starting, let’s say, on April 6 [note to readers: this analysis was drafted before Moscow announced its lockdown on March 30].
The table below shows the simulation results for all five scenarios (including a scenario where the authorities take no action against the spread of COVID-19). Scenario B (heightened restrictions on social contacts without a citywide lockdown) allows Moscow to cut the mortality rate by more than half and reduce the number of patients needing ventilators at the peak of the epidemic to a figure that (at least theoretically) could be managed by mobilizing every ounce of the medical system’s capacity (especially since the epidemic’s peak wouldn’t come for another three months). This scenario, however, would require maintaining restrictions for at least a year (or until scientists create and mass produce a drug or vaccine against COVID-19) and a new wave of infections would still be possible after these limits are finally lifted.
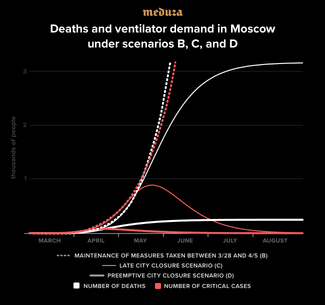
The scenario improves when officials impose a lockdown because it lowers the number of victims by orders of magnitude and reduces the burden on the healthcare system to an acceptable level. The risk of a second wave of infections after a lockdown is lifted, however, is extremely high. Theoretically, it’s possible that authorities could control the spread of new outbreaks after suppressing the initial epidemic by quickly identifying and isolating new patients (following the experience of South Korea and Singapore), but it’s completely possible that the disease could start spreading out of control again, requiring another lockdown.
Perhaps the most obvious conclusion of this analysis is that a preventative lockdown is strongly preferable to a delayed lockdown: it lowers the burden on the healthcare system, leads to 10 times fewer deaths, and significantly shortens the epidemic’s duration. Consequently, the decision to impose a preventative lockdown on Moscow seems perfectly reasonable.
Scenario
0
A
B
C
D
Quarantine level
none
low
moderate
late lockdown**
early lockdown
Total number of deaths
117,000
92,000
43,000
3,200
250
Peak of epidemic
May 15
June 6
July 15
May 21
April 18
Maximum ICU bed demand
48,500
32,000
7,500
900
80
Epidemic end date*
June 26, 2020
July 22, 2020
May 2021
July 6, 2020
May 1, 2020
Risk of second wave
none
none
significant
high
high
(**) Assumes moderate quarantine measures followed by a lockdown when the daily death rate hits 30, which is predicted to occur around May 5.
V. Know that these forecasts are optimistic
If you’ve gotten this far in this text, you might think I’m deliberately trying to scare you. Claims about coronavirus possibly killing as many as 120,000 people in Moscow seem both eerie and implausible. You should know, however, that the parameters and modeling refinements used to reach the conclusions presented here rely on several very optimistic assumptions:
- We assume that COVID-19 is a seasonal illness and that its infectiousness at the peak of the epidemic in May and June will be 15 to 25 percent lower than it was according to data from March. (This is a plausible but unconfirmed assumption.)
- We assume that 50 to 95 percent of COVID-19 cases are light or asymptomatic and that the disease’s average real severity is significantly lower than data from Italy and Spain suggest. In our five simulated scenarios, COVID-19’s lethality ranges from 0.7 percent to 1 percent, which is at the lower edge of plausible estimates.
- We didn’t factor in additional increases in mortality caused by patients who can’t get access to ventilators, not to mention the wider consequences of a potential collapse of Moscow’s healthcare system if the epidemic overwhelms hospitals, which would lead to tens of thousands of additional deaths at the very least.
- We only modeled Moscow’s population, though the city and surrounding region are in fact a single metropolis with a population of almost 20 million people. Whatever happens within the city itself would naturally unfold similarly at about the same rate in the surrounding region.
- In scenarios B and C, we assumed that the restrictions gradually imposed by city officials were effective. So far, there’s no evidence that this is actually what happened. As demonstrated by Figure 1 in this text, Moscow’s coronavirus curve still shows no signs of flattening.
In other words, the Scenario 0 tabled above represents a cautiously optimistic assessment of how COVID-19 would spread in Moscow without any effort to suppress the epidemic. Why have others projected that the coronavirus will kill far fewer Muscovites? It seems many observers expect the epidemic to reach only a small fraction of the population (spreading to no more than a few percent or even a few tenths of a percent) before dissipating for some reason on its own. These expectations lean on life experience gained from observing diseases against which significant parts of the population are already fully or partially immune, such as influenza or chickenpox.
With COVID-19, however, it’s crucial to understand that we’re dealing with a new disease against which no one is immune. The logic behind the expectation that this virus will stop spreading spontaneously after infecting just 1 or even 10 percent of the population is as sound as the belief that a brick plummeting toward your head will freeze in midair, a few feet shy of your noggin.
A disease spreading in a population without immunity can lead to only two outcomes: either it is suppressed or it spreads and covers a significant proportion of the population (with COVID-19’s R₀ values, it would obviously spread to more than half of everyone). At the same time, more effort and resources are needed to suppress the epidemic, the larger it becomes. While the number of cases is in the dozens or hundreds, suppression is possible through relatively easy measures: isolating infected patients and identifying and quarantining anyone with whom they may have been in contact. In Moscow, COVID-19 has already spread beyond this stage. The city missed its chance at such an inexpensive containment policy. In large-scale epidemics, the only available response is a large-scale quarantine imposed on the entire population. The sooner and more strictly these measures are introduced and enforced, the faster the epidemic can be suppressed and the lower the costs will be for society and the economy.
Text by Moscow State University Associate Professor Mikhail Tamm, edited by Dmitry Kuznets and Kristina Safonova, and translated by Hilah Kohen and Kevin Rothrock
Acknowledgments: The model used for the calculations presented above was designed by Richard Neher and colleagues at the University of Basel. It is available at the following hyperlink: neherlab.org/covid19. Mikhail Tamm is also grateful to Sergey Maslov at the University of Illinois Urbana-Champaign for productive discussions during the process of completing this analysis.