Russia's economic projections in 2 graphs A look at how the government has (mis)calculated its budget over the past 15 years
Vladimir Putin has signed the federal budget for next year, which is based on oil being priced at $50 (it's less than $39 now), the dollar trading for 63.3 rubles (today it trades at more than 70), and inflation staying under 6.4 percent. While these seem to be dangerous miscalculations, it's not the first time Russian officials have adopted a budget with strange projections. But how seriously and how often have they been mistaken? To demonstrate, Meduza presents two graphs: one about inflation and the other about the ruble-dollar exchange rate.
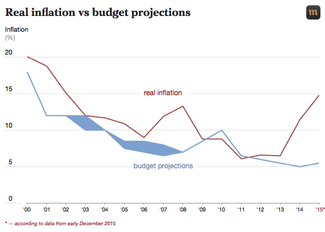
Graph I: inflation
This graph shows that the best economic forecasts were in the early 2010s. At all other times in the past 15 years, government projections underestimated inflation. (The filled-in sections of the graph indicate where forecasts included a "range.")
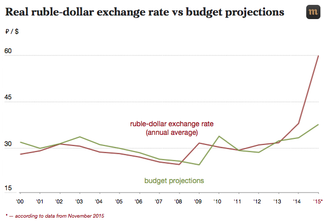
Graph II: the ruble-dollar exchange rate
In the early 2000s, the ruble strengthened against the dollar even faster than the government anticipated. After 2008, things changed. Since then, the state's ability to project the ruble's exchange value has been a sometimes thing.